
A model does not have to answer a prompt for someone to get a copy of it. In a November 19, 2026 report, Dragos researcher HD Moore described a particularly telling observation. A provider rejected some inference requests before a model ran. AWS credentials planted exclusively in those requests were subsequently used. That puts the provider’s request intake and the systems that could read from it squarely in the investigation. Dragos research report
How did Dragos trace LLM prompt leaks?
From July through November 2026, Dragos sent roughly two million synthetic prompts. Each request carried identifiers used nowhere else, including a URL, a DNS name and a monitored credential. The team recorded the model, router and privacy settings. A later event at a controlled service could then be matched to the request that carried its marker. To investigate intermediaries, Dragos compared image retrievals with the service information preserved in layered error responses. It reported tracing about 2,000 routes, some only partially. HD Moore’s description of the experiment
The researchers described evidence of compromise at three providers, marketplace sellers reading customer prompts through built-in request logging, and delayed visits to links sent under restrictive privacy settings. One link appeared in a Feishu chat 24 days after submission. These findings concern inference data after submission. Establishing that someone trained a model on a prompt would require different evidence. Dragos findings and disclosure timeline
For a team buying model access, the experiment suggests a precise question. If a synthetic marker returned tomorrow, could you name the individual submission it came from, explain who had a reason to touch it, and find the owner of the next missing piece of evidence? Answering even the first part requires some preparation. An opaque ID in the model response is useful to the provider. Your own record needs to connect that ID to what the application actually sent.
What a canary callback proves
A prompt canary is a piece of deliberately planted data whose use can be observed. With an HTTP canary, an observer can tell that a particular address was requested. A sensor can remain silent while somebody reads the string, copies an archive containing it or passes it through a data pipeline. The event that makes the marker visible depends on the design of the sensor. Thinkst documents the basic HTTP token as a unique URL that triggers when requested. Thinkst’s HTTP Canarytoken guide
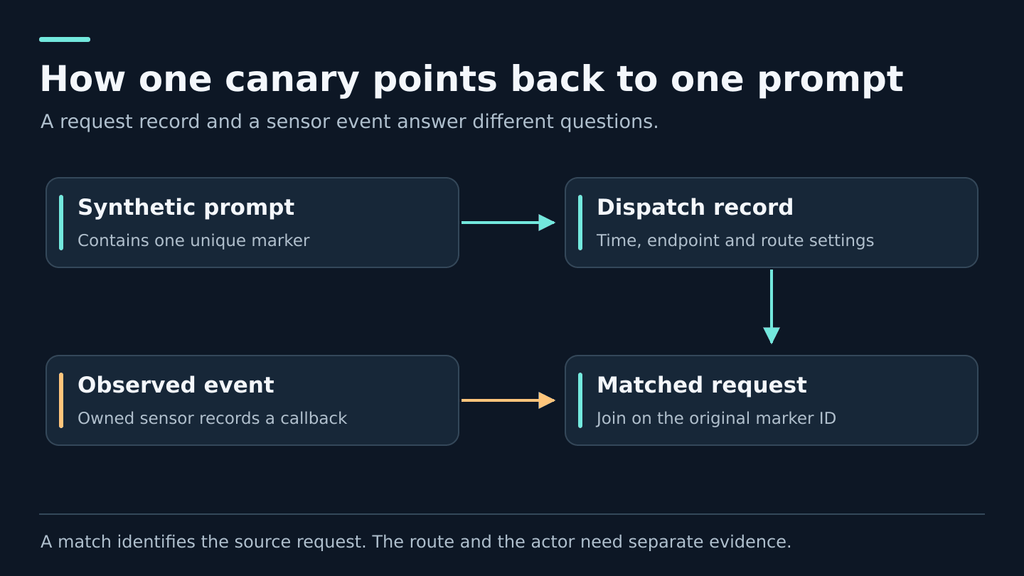
Think of an investigator holding two slips of paper. On one is a record of which request received a unique marker. On the other is a record of the action the sensor saw. The common identifier establishes a connection between records. Everything else needs evidence of its own. A valid join says nothing by itself about whose desktop initiated the action, whether the full prompt traveled with the marker, or which organization retained a copy. A conclusion can become more specific as more records arrive.
That distinction makes the first report to a vendor much easier to write. “The address unique to request R was fetched 37 hours later” is a claim the two parties can examine together. “Your staff read our conversations” quietly adds a human, a particular employer and a much larger set of data. Each addition could change who gets paged, whether a customer is contacted and how long the team spends pursuing the wrong explanation.
| Observation | What the record establishes | Evidence worth seeking next |
|---|---|---|
| A unique hostname was resolved | A DNS query reached the observation point | Resolver ownership and the matching application activity |
| The complete private URL was requested | A client had enough information to request that path | Feature settings, preview behavior and the request timeline |
| A monitored credential was presented | Someone or something had the credential material needed for that attempt | Native service audit event, outcome and authorized test activity |
| A marker was seen long after submission | Some component could obtain the marker at that later time | Support, queue, logging and other downstream records |
| No event appeared during the watch period | The selected sensor recorded no activation during that interval | Positive control, duration and actions outside the sensor’s coverage |
A DNS resolver is often an intermediary. An address shown by an authoritative DNS server can belong to the resolver used by the requesting system. HTTP adds detail, including which resource was requested, but an HTTP client name comes from the request. Treating either field as an employee identity is a leap. A service owner can often corroborate the event with a matching time, job ID or egress path. An internet address by itself rarely answers that question. IETF DNS terminology ve HTTP semantics
Why the route matters more than the model name
Imagine two applications sending the same model the same synthetic support ticket. The first uses a service contract for a specific endpoint. The second addresses a broker that can choose between several hosting offers. The name printed above the generated answer could be identical. The list of organizations able to explain a delayed callback could be entirely different. A deployment inventory that lists only a model name cannot tell the investigator which support channel to contact or which agreement to consult.
Draw the path starting where the prompt is assembled. The application may add retrieved passages, a file summary or the result of an earlier tool call. Then mark the point where it serializes the outbound request. A router may accept the result and select an upstream. The return trip can produce another durable record if the application captures the response. Draw side branches for traces, retries and support exports. For each branch, ask who can inspect actual content and who sees only timestamps or a billing count. Those two kinds of access have different consequences.
A useful inventory entry names a workload, an endpoint and a route policy. For a fictional support summarizer these could be “case-note draft,” “approved text endpoint” and “one approved upstream, stop if unavailable.” Separately record the date, application release and owner of the route rule. This captures the conditions under which the statement was true. If a team changes how it buys inference six months later, the old record can still explain a callback associated with the earlier arrangement.
An account dashboard can establish what someone selected. A dispatch record can establish which setting the application sent. A receipt or upstream record can establish something about the path the provider says it executed. Keep all three when the distinction matters. One common review mistake is to find today’s dashboard setting and paste it into a report about last Tuesday’s request. The setting may have changed legitimately, or a different project key may have carried the traffic. Record the source and observation time of each piece.
Fallback deserves its own row in the inventory. If the cheapest or fastest option is unavailable, which routes can carry the same prompt? If none qualify, does the application stop, or does a second integration take over? OpenRouter’s public documentation describes provider ordering, restrictions and fallback controls. That is an example of a product interface that can express a routing decision. An application still needs to decide how it should behave when its permitted options are exhausted. These documentation examples describe controls and do not identify the providers in the Dragos incidents. OpenRouter provider routing
A support ticket saying “the model was down” is an opportunity to check this distinction against actual design. Ask the application owner to show the next operation after an approved endpoint returns an error. If the answer is “we try the backup integration,” give that integration its own entry and owner. If the answer is “the SDK handles it,” ask which version is deployed and what evidence it leaves. The incident team should be able to follow one attempt across the boundary without copying the user’s conversation into a ticket.
Read zero data retention as a set of specific promises
Four questions routinely get compressed into a single privacy checkbox. Can the provider use input or output for training? Can it store the payload for another purpose? Who processes it? In which locations or services may that processing happen? A procurement answer about training leaves the remaining questions open. An infrastructure answer about where the model runs leaves open where request traces, attachments or exported support cases live. Give each question a place in the acceptance record.
First identify what the policy calls Veri. A prompt body, attachment, generated response, account identifier, usage total and abuse-monitoring record can have different treatment. The OpenAI API documentation, for example, distinguishes abuse-monitoring logs from application state and describes endpoint-specific behavior under its data controls. A team reviewing a different supplier should obtain that supplier’s own definitions. A statement about one API product cannot be carried over to an unrelated consumer feature or a broker’s copy of the request. OpenAI API data controls
Next ask how the policy binds the route. OpenRouter’s published data processing agreement describes its ZDR-only routing in terms of selecting providers designated eligible in its registry. The designation relies on the upstream provider’s stated policy. Its product documentation separately discusses in-memory prompt caching. For a buyer, those details identify two different requests for evidence. One concerns the selection made for an individual request. The other concerns the definition of retention used by the organizations involved. OpenRouter data processing agreement ve OpenRouter ZDR documentation
Then identify any feature that changes the object being processed. Asking for a plain text completion, asking a service to retrieve a picture, and uploading a document for continued conversation are three different product decisions. A company may approve one for confidential use and reserve the others for public material. Write that distinction where engineers choose the feature. A purchase approval that lives only in a procurement spreadsheet is hard to apply when a developer turns on attachments or an agent gains a new tool.
Finally write down what an unexpected observation would contradict. If the promise is “route only to the suppliers listed in this annex,” and a vendor confirms a different processor received the payload, the disputed point is specific. If the observation is a delayed fetch and the contract permits a documented asynchronous task, timing alone leaves an open question. The team can ask for the job’s purpose, the request identifier that originated it and the deletion rule that applied. A technical finding becomes considerably more useful when someone can identify the sentence or control it puts in doubt.
Design an internal prompt canary test that somebody can interpret
Choose one decision before generating a marker. For example, “Can our support summarizer send a plain text prompt on the approved route without a subsequent unexplained URL fetch?” has an owner, a data type and an observable outcome. “Is our AI private?” has none of the three. A narrow test can change a release decision. Even a large collection of callbacks cannot answer an undefined question about every product feature and every form of disclosure.
Start with a service and a test tenant your organization operates. Use a synthetic support case with no production ticket number, personal details or working secret. One credible example is an invented shipment delay and a reference to a fictional runbook. The task can ask for a short summary of the delay. If that workflow ordinarily processes plain text and has no reason to retrieve links, an address appearing as an incidental reference gives the reviewer a clear expected behavior. Confirm that the client itself does not render a rich preview before the request leaves your environment.
A different test is appropriate for a feature designed to fetch a resource. Use a team-controlled benign resource and document the fetch the feature is expected to make. The initial fetch then serves as a positive control. A second fetch under different conditions might merit attention, but the expected one should have an owner and an explanation before the test starts. Mixing these two designs produces a dataset in which perfectly normal behavior looks like a failure every time.
Pick a marker that matches the question
An HTTP marker suits a question about link retrieval. A DNS-only marker suits a question about name resolution. A permissionless managed credential can address a question about credential handling if the organization already has the monitoring and approvals to use one. Thinkst describes its managed AWS credential tokens as associated with its own infrastructure and carrying no permissions. That differs from creating an ordinary access key in a live customer account. For a first exercise, an opaque reference in synthetic text and a team-owned receiver are enough to teach the correlation method. Thinkst’s explanation of its AWS Canarytokens
A marker should be unpredictable and exclusive to its dispatch. Keep the lookup table inside the test team’s boundary. Putting the complete link into a planning document, a launch ticket and the actual prompt creates at least three possible sources for a hit. If people need to discuss the test beforehand, give them a separate case reference. The incident coordinator can use the reference to find the restricted record without giving every chat client in the organization a fresh opportunity to retrieve the link.
There is a small but consequential choice at the retry boundary. If your application retries a submission it can identify as a new attempt, give that attempt a fresh marker and record the common parent operation. If a managed client transparently resends identical bytes, note the resulting ambiguity. A hit can then be associated with that family of attempts. Claiming that it identifies a particular upstream execution would require a provider’s attempt records. Keep retries visible in the ledger even when the customer-facing feature reports a single success.
Build controls into the dispatch record
Set aside an unsubmitted negative control created by the same process and monitored by the same receiver. If that marker activates, pause interpretation of the sent cohort. Your generator, inventory, monitoring interface or notification path may itself be exposing marker values. The negative control can reveal contamination even when every test prompt was routed correctly. Choose an investigation owner in advance so this result triggers an examination of the instrument rather than an accusation against a provider.
Use a separate, explicitly labeled positive control for a known test fetch. Record who initiated it, its expected time window and the way it should appear in the receiver’s records. Run it through the alerting workflow, including the notification channel. A dashboard that displays the event while the on-call queue stays empty has revealed a monitoring fault. The positive control proves that a particular kind of event was observable at that moment. Its result does not establish continuous coverage for an entire month.
| Test case | Variable kept distinct | Decision if the result is unexpected |
|---|---|---|
| Unsubmitted negative control | No inference submission | Inspect local handling of markers before interpreting provider results |
| Known monitoring control | A designated operator makes one expected fetch | Repair event collection or alert delivery before relying on silence |
| Plain text synthetic request | The feature has no documented reason to retrieve a URL | Examine application telemetry, link previews and the selected route |
| Approved media retrieval | A specific service is expected to retrieve a resource | Compare timing and purpose with the feature’s documented behavior |
| Simulated route unavailability | A team-owned staging dependency reports unavailable | Confirm the workload stops or takes an explicitly approved alternative |
Do not tie the whole exercise to a one-off demonstration in front of executives. A demo tends to favor an immediate visible outcome. Delayed observations are part of the question. Record how long each marker will be observed, where late events land and who owns that queue after the project closes. Keeping minimal synthetic identifiers available can let the organization interpret an old callback without retaining the original prompt body just to make a future investigation possible.
Keep a ledger the responder can actually use
A compact dispatch record can carry a case reference, a unique attempt ID, the marker ID, the issue time in UTC, the workload, the requested model, the configured route, the required privacy setting and the application’s outcome. Attach a reference to configuration evidence and a provider request ID when available. Give reported upstream, observed upstream and unknown upstream separate values. A blank field accidentally interpreted as “direct” can turn missing evidence into a reassuring dashboard.
The receiver has a different job. It records an event ID, event time, observation point, marker ID, action type and a pointer to the underlying evidence. If your platform exposes both arrival time and processing time, retain both in the restricted event record. A queue delay inside the monitoring service can otherwise look like a delay between inference and access. Write down the time zone at collection. When two clocks disagree, the responder needs the uncertainty along with the timestamps.
The lookup table itself is sensitive in an unusual way. A person with a list of active markers can produce events that look as though they originated elsewhere. Limit access to people who need to administer the experiment and distinguish their checks with dedicated control markers. Keep general analytics on a derived view containing case references and classifications. That design lets product managers follow the work without acquiring the ability to alter the interpretation of the next event.
There is no need to log every prompt to make this correlation. An application-owned interaction ID and a pointer to a tightly scoped synthetic fixture are often sufficient. OWASP recommends collecting an interaction identifier where useful and describes credentials, access tokens and other material that generally needs removal or protection in logs. W3C Trace Context also discusses privacy considerations for identifiers propagated across systems. Decide deliberately which internal identifiers should travel to an external provider. OWASP logging guidance ve W3C Trace Context
Try the correlation offline with three event records
The following Python example uses invented identifiers already present in memory. It reads two small collections, associates observed events with dispatched markers and calculates the elapsed time. It makes no network calls and needs no credentials. The exercise is useful in an incident review because everyone can see which conclusion comes from the join and which conclusion requires human judgment.
from datetime import datetime

def utc(value):
    return datetime.fromisoformat(value.replace("Z", "+00:00"))

dispatches = {
    "m-31": {"case": "plain-text", "sent": "2026-10-01T09:00:00Z"},
    "m-32": {"case": "image-fetch", "sent": "2026-10-01T09:05:00Z"},
}
events = [
    ("m-32", "2026-10-01T09:05:04Z", "http-fetch"),
    ("m-31", "2026-10-02T10:00:00Z", "http-fetch"),
    ("m-99", "2026-10-02T11:00:00Z", "dns-query"),
]

for marker, observed, action in events:
    record = dispatches.get(marker)
    if record is None:
        print(marker, action, "unmatched")
        continue
    elapsed = utc(observed) - utc(record["sent"])
    print(marker, record["case"], action, elapsed)
The first row joins to the image feature four seconds after dispatch. That fits the design if the designated image service also confirms the fetch. The second joins to the plain text case after one day and one hour. That row earns an investigation because the feature had no planned retrieval. The third row remains unmatched. Counting it against either provider would manufacture a finding. A real collector would preserve it for reconciliation with the correct inventory or a known monitoring control.
Extend the exercise on paper by adding a second event for m-31. You now have two observations for that marker and still only one matched dispatch. Decide whether the second event changes the explanation. A second HTTP request from a preview service seconds later may tell you little. Independent confirmation that an operator used a credential unique to the same dispatch would change the evidence substantially. Counting both as a single undifferentiated “hit” erases exactly the distinction responders need.
One more change exposes a hidden assumption in many dashboards. Give two dispatches the same marker and repeat the exercise. The mapping in this small example cannot represent both records without overwriting one. An operational system should reject that duplicate at creation or explicitly return an ambiguous match. Readers reviewing an existing tool can ask to see this failure case. A tidy event table is only as trustworthy as the uniqueness and time assumptions that made the join possible.
Triage the event before naming a provider
Suppose a synthetic link is fetched twenty minutes after dispatch. The alert includes a familiar cloud network and a browser-like user agent. The fastest way to waste the next hour is to start by trying to name a person from those two fields. Start with the event you already own. Confirm the full marker match, the observation point, the original feature and the timeline. Then ask which systems were allowed to use the address and which have a record of doing so.
Inspect the notification workflow early. If a security bot posts the full live address into a chat room when an alert fires, the chat platform may fetch its own preview. Slack documents that its classic link-unfurling behavior crawls posted links. This creates a practical trap. The first unexplained event prompts an alert, the alert generates an explained second fetch, and both appear in the same case minutes apart. An incident card carrying a redacted case reference prevents the investigation from adding ambiguous events. Slack’s link-unfurling documentation
A second trap is the responder opening the link to see what happened. Keep a static evidence view showing the request time, observed action, matched marker reference and an approved excerpt of surrounding telemetry. Give the operator a separate synthetic control to use when checking receiver health. If somebody has already opened the live marker, record the time and action in the incident history. That record can explain the new event while preserving the value of the earlier evidence.
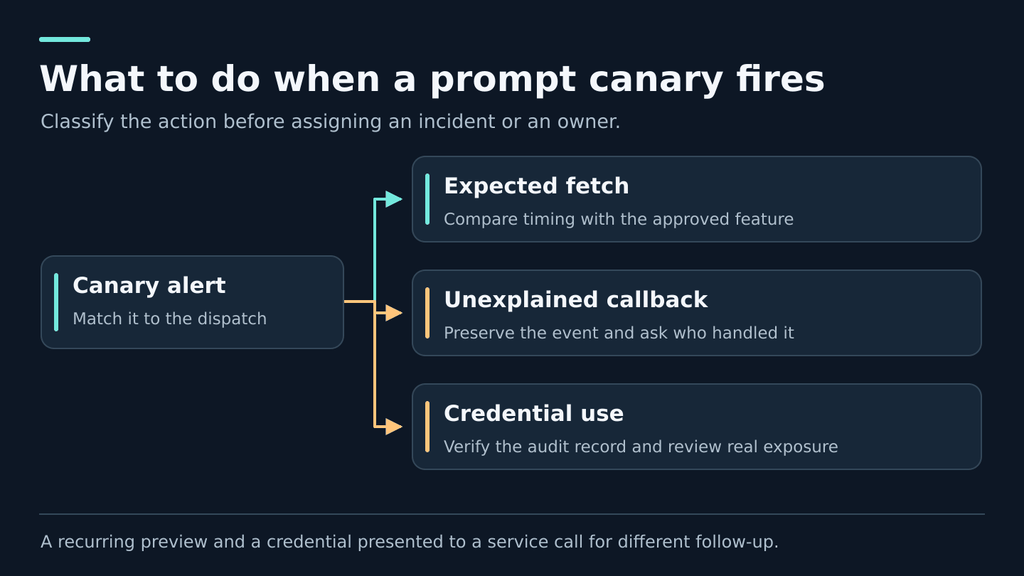
A chat preview can account for an HTTP fetch. It does not account for every event associated with a credential. When a credential sensor fires, obtain the service-native event and read the outcome. An attempted action may have been denied. An event about one credential also leaves open whether any real key was exposed, which permissions were available and whether any customer data was accessed. Each of those questions has a different source of evidence. AWS CloudTrail record contents
Read service-native audit records with the right scope
For an AWS-related investigation, request the event time, event name, identity context, result or error, and the region in which the team searched. Preserve the event identifier so another reviewer can retrieve the same record. A source IP or user agent is context. A successful action against a specific resource has a different evidentiary value from a denied call. CloudTrail documents its fields and which ones may be absent or optional. The incident record should distinguish an absent value from a verified negative result. AWS CloudTrail event fields
There is also a practical limit to a quick console search. CloudTrail Event history provides a regional view of management events for the last 90 days. Teams needing other event types or a longer lookback should identify the relevant trail or event data store and its configuration. Write down what was searched, in which account and region, across what interval. A note saying “no activity in AWS” erases the boundaries of the search precisely when an independent reviewer needs to assess them. AWS guidance on Event history
Assign a human owner to the next evidentiary gap. The application team can verify what went into a request. Platform engineering can identify the gateway policy in effect. The cloud security team can verify the monitored account’s audit record. A supplier may be the only party able to identify the purpose of an asynchronous process. An incident stalls when all four groups receive the same vague request for “all the logs.” A separate, narrow question for each team usually yields a much shorter investigation.
Compare plausible explanations
Consider a fictional service that renders a document thumbnail. A marker associated with an image is fetched twice. The first event occurs during the original request and the second after a short delay. The feature owner identifies a thumbnail worker and produces a job record with the correct request ID and both times. If the route, feature policy and purpose all match the approved design, the case can close as explained. Keep the evidence reference so the next operator can recognize the same behavior. Do not add the entire network to a permanent allowlist on the strength of one explained case.
Now change one fact. The job record accounts for the first fetch only. The second came two days later, after a support case was opened. Check who or what received the support bundle and whether it included the full address. An authorized support copy, an undocumented support export and a compromised upstream are three different outcomes. The delayed event is the start of that inquiry. It cannot decide among them on its own. If the support tool explains the event, the remaining question is whether that copy was permitted and appropriately retained.
Finally consider an event involving use of a synthetic credential sent in a plain text task. The approved workflow has no credential-validation feature. The receiver confirms the identifier and rules out the test team’s positive control. That is enough to escalate and review the affected route while the parties establish who handled the input. Waiting for the name of a particular individual before limiting exposure would leave the application relying on a control whose behavior is already in doubt. Attribution and containment can run on different clocks.
Measure affected requests, repeated hits and observation time separately
A single active marker can produce many callbacks. Another marker could be copied into an archive without ever firing. If a dashboard divides total callbacks by total prompts and names the result a leak rate, it combines unlike quantities. Use a denominator that corresponds to the question being asked. Count distinct eligible dispatches when measuring the proportion with an observed action. Count events when measuring workload at the receiver. Count corroborated incidents when reporting what the response team established.
Here is an illustrative set of numbers invented for a reporting exercise. Two hundred plain text test requests were sent on one approved route. One hundred and sixty reached the full observation interval. Eight of those mature requests produced a total of forty HTTP events. Of the eight, six were explained by a documented internal preview and two remained under investigation. The other forty requests had not yet reached the end of the observation interval. None of these figures comes from the Dragos study.
| Question about this example | Calculation | Interpretation |
|---|---|---|
| What fraction of mature requests had an observed HTTP event? | 8 divided by 160, or 5% | Observed marker activations in this cohort |
| What fraction of mature requests remains unexplained? | 2 divided by 160, or 1.25% | Open cases under the stated classification rules |
| How much HTTP event traffic did the receiver process? | 40 events | Collection and triage load, including repeat activity |
| How many recent requests lack a full watch window? | 40 of 200 | Incomplete observation at the reporting cutoff |
The two percentages could change in different directions. A new callback on a mature marker might raise the first percentage. A support vendor producing a credible job record could lower the second while the first remains unchanged. Version the classification separately from the raw event so both statements can be reconstructed. When reporting to leadership, include a date and name the level of evidence. A statement such as “two synthetic dispatches remain unexplained as of Friday” can survive later correction without exaggerating customer impact.
Be careful when comparing routes. If route A handled plain text for six weeks and route B handled image requests for three days, their callback fractions measure different things. Match the feature, test content class, privacy setting and observation window first. Report how retries were grouped. Where traffic is sparse, publish the counts as well as a percentage. Two hits in ten and twenty in a hundred produce the same percentage yet leave a reader with quite different evidence about repeatability.
Even a matched comparison cannot reveal silent storage. If a receiver observed zero callbacks in a quiet cohort with working controls, the cohort can serve as a baseline for that sensor. A buyer still needs documentary and operational evidence for how the supplier handles stored content. Document why a result changes a particular decision. “Continue this limited pilot while completing the logging review” is defensible on narrower evidence than “approve all sensitive workloads.”
Put latency on the incident timeline
Keep at least three times when they are available. The dispatch time says when a marker left the application. The receiver’s time says when an action became observable. The alert-delivery time says when the on-call person had a chance to act. Differences between the first two can help assess a delayed event. Differences between the last two measure an internal operational problem. Combining them into a single “time to detection” hides which organization owns the delay.
The last observed event also needs careful phrasing. If a marker was fetched on days one and fourteen, the records establish access on those dates. They leave open how the marker was available between them. It could have remained in a copy, been forwarded earlier or been retrieved from another system. If a vendor later supplies a support export dated day two, add it as a new observation, with its provenance. A timeline built from individually sourced entries can be updated without rewriting the whole story.
Plan for late callbacks before the people who ran the pilot move to a different team. A reasonable handoff includes the experiment owner, the receiver’s owner, the date on which the mapping will expire and the approved destination for late events. Decide what happens when a callback arrives after the detailed mapping has been deleted. The team may still record sensor activity but must narrow what it claims about the original route. Deliberately accepting that limit may be a better privacy decision than keeping every old prompt indefinitely.
Reduce the amount of prompt data available to leak
The cheapest copy to investigate is the one the application never generated. Look first at the transformation that turns a user action into model input. A ticket summarizer may need the statement of the problem and one recent exchange. It may gain little from the full ticket history, authentication headers or an attached diagnostic bundle. Ask the product owner which pieces are necessary to produce an acceptable answer, then test the shorter input against representative synthetic cases. Treat output quality as a measurable constraint on minimization.
Redaction belongs close to the context assembly step. Applying it exclusively to what the user types leaves retrieved documents, tool results and application-added metadata untouched. Applying it only at the gateway leaves earlier local traces with the original payload. For one representative action, identify the earliest point at which the sensitive item is present and the latest point at which it is genuinely needed. The difference between those two points defines a concrete engineering change.
Give the model a reference when a trusted system can perform the sensitive operation on its behalf. In a hypothetical internal support workflow, the model might suggest opening an approved case action. The application can check the user’s entitlement and pass a short-lived internal reference to the service that executes it. The model does not need the underlying service credential to draft a summary or choose between two permitted operations. Document the mapping and the component responsible for verifying it. Test that a failed lookup produces an explicit and recoverable failure.
Turn next to observability. Decide which teams need latency, model identifiers, usage counts, error families or content. These are separable requirements. A developer troubleshooting latency can often work with timestamps and request sizes. An authorized reviewer investigating a quality regression might need a small sample of synthetic or separately approved content. OpenTelemetry’s GenAI attribute registry explicitly describes model input messages as potentially sensitive. A tracing standard providing a field for content is a reason to make a collection decision, rather than enabling it everywhere by habit. OpenTelemetry GenAI attributes
Check the failure path as carefully as the success path. A logging policy that removes prompt bodies during successful requests can still be defeated by a local exception formatter that serializes its input. In staging, use an invented case with a unique inert text reference and exercise the application’s normal error handling. Ask the service owner to locate the resulting error entry and confirm which fields survived. Keep the synthetic reference distinct from a monitored URL. This local content check answers a different question and benefits from a marker that cannot be accidentally activated.
Apply the same scrutiny to incident attachments. A customer service representative may export a full interaction to help engineering reproduce a quality issue. A safer support template can ask for the problem category, request ID, relevant timestamps and an approved extract first. Name the person who can authorize access to additional content when the initial record is insufficient. A support team with a workable narrow path is less likely to build its own archive of entire conversations just to get a ticket accepted.
Agent trajectories need a second review before export
A trajectory records a sequence of model interactions and tool activity. Imagine an agent working through a synthetic refund case. One step retrieves a customer-style record, another asks a model to summarize it, and a third saves the model output alongside the tool result for later evaluation. Even if the inference provider honors its retention commitment, the application has intentionally created a new dataset. Anyone evaluating the privacy of the whole workflow needs to account for that second destination.
Run two distinct cases if your organization exports trajectories for evaluation or training. In the first case, observe the inference path with the export disabled. In the second, enable the approved export in a test environment and use fresh synthetic identifiers. Keep the identifiers associated with the same fictional task but exclusive to each attempt. If an unexpected copy turns up in the evaluation workspace, the team can investigate the export path separately from a callback at an inference endpoint.
Within a trajectory, distinguish the input to a model, the tool’s response and the material actually retained in the evaluation sample. An agent may read a large tool result while the evaluator needs only the selected action and whether it met the task requirements. Let the team designing the dataset explain what each retained field contributes. If a field exists only because it was easy to serialize, test whether the evaluation remains useful after removing it. This turns a privacy discussion into a specific choice about the quality and reproducibility of the dataset.
A buyer of such data can request an example of the transformation using a wholly synthetic case. Begin with the source fixture, follow it through a short trajectory, and inspect the exact files that a customer would receive. Verify that free-text fields, screenshots, attachments and exception traces receive the agreed treatment. A manifest asserting that a dataset has been cleaned is easier to interpret alongside a worked example where the buyer can see which source fields were kept, transformed or dropped.
Separate the evidence you need from the evidence you should distribute. A vendor may need a restricted provenance record to explain where a synthetic sample originated. A downstream evaluator may need only a stable sample ID, task description, score and release version. Decide what should happen if a later review identifies an exposed sample. A versioned manifest can identify the affected release and its recipients without placing the full original conversation in an email to every downstream user. The more organizations involved, the more valuable that small design choice becomes.
Ask an inference supplier for evidence it can return
A useful first contact fits on one screen. Give the supplier the UTC time, its request ID if available, the feature, the privacy setting your application recorded, and a short description of the observed action. State what part of the path you control. Include a redacted marker reference that allows both sides to identify the case through an agreed channel. Avoid including the complete active marker in a general support ticket. The supplier should be able to allocate the issue without creating another unexplained copy.
Ask the supplier one question it is equipped to answer. For a delayed link fetch, request the identity and function of any service associated with that request and time, including documented downstream processors. For a rejected request, ask where rejection occurred and which components received the body first. For an apparent route change, ask for the attempt-level upstream selection and the policy in effect on the date in question. These requests produce specific records even when nobody yet agrees on the explanation.
| Procurement question | Evidence a supplier can return | Decision it informs |
|---|---|---|
| Who may receive this workload during normal service or an outage? | Dated processor list, endpoint restrictions and fallback behavior | Whether the application can use the route for this data class |
| Which components retain inputs, outputs or derived content? | Feature-specific retention schedule covering support and diagnostics | Whether to enable attachments, tracing or persistent sessions |
| How can we verify a past routing decision? | A worked synthetic request with timestamps and a redacted upstream receipt | Whether the incident team could reconstruct an actual case |
| What happens if the route cannot meet policy? | Staging evidence of the documented unavailable-path behavior | Whether a fail-closed requirement works in practice |
| How are unexplained observations investigated? | Named response channel, escalation owner and supported evidence format | Whether operations can act within the organization’s response window |
Ask the procurement owner to translate broad answers into conditions engineers can implement. “Approved for enterprise use” has little value to a developer deciding whether to enable a web-retrieval tool on a confidential project. “Text-only summarization on this endpoint, using the approved account and route list, with content tracing disabled” gives a narrower and testable approval. Record who can expand that approval and what new evidence they will need. Reviewed exceptions should expire or have an owner who revisits them.
Make room for honest unknowns in the vendor response. A provider may be able to account for ingress, billing and its own model workers yet need an upstream partner to investigate a background task. Ask which boundary its evidence covers and when the next owner will respond. If two organizations each refer responsibility to the other, that is a procurement finding even before anyone proves misuse. The buyer has learned that it cannot currently obtain the evidence it would require after a real incident.
Make containment and re-testing answer different questions
When an unexplained credential event is corroborated, take a time-bounded decision about the workload. For example, pause the sensitive data class on the affected route and continue serving an approved alternative that the team can account for. Record who can restore service and what evidence they need. A fake credential created solely for the exercise does not imply that every real key must be rotated. Review which real secrets could have entered the same path. Where a specific live credential may have been exposed, have its owner revoke or rotate it and review activity under the established response process. AWS guidance on managing access keys
Preserve the old case while testing the fix with a fresh marker. An old marker can continue to fire because it was already copied. A new marker passing through corrected routing tests a different proposition. Mixing these cohorts can make an effective fix look broken or allow a fresh exposure to disappear among historical noise. A remediation report should state which result concerns previously submitted material and which concerns new submissions after the change.
A release decision can use several kinds of evidence together. The application team can show that its error logger no longer records content. The gateway team can show a documented fallback test with the approved destination unavailable. The supplier can account for the earlier job or provide an investigation status. A working positive control can establish that monitoring survived the configuration change. An individual owner should decide whether the combined result is sufficient for the data class being restored. General incident response guidance also treats recovery and follow-up as part of ongoing risk management. NIST incident response recommendations
Consider two possible closeout statements. “Issue fixed, nothing else seen” forces a future investigator to start over. “For text-only support summaries on the named route, the old preview job was disabled, both application paths passed the staging acceptance test, and the new cohort completed the agreed observation interval” has a recoverable scope. Add the date, owner and remaining uncertainty. If a new product feature changes the route later, the approval record makes clear which part needs another review.
Frequently asked questions
Can a callback show that a model trained on our prompt?
- A callback records an interaction with the marker. A training claim requires evidence about ingesting the content into a training pipeline. Ask separately about retention, dataset construction and training use.
How should we interpret a URL fetched during the original request?
- Check whether the enabled feature needed that resource, then match the fetch with its owner and job record. A documented image retrieval and an unexplained request from a text-only workflow have different implications.
Can we test this without using real credentials?
- Yes. A synthetic prompt and a unique, team-controlled URL are enough to test link retrieval. The offline example above lets a team practice matching and triage without sending a request at all.
Which record should we keep if the provider rejects the prompt?
- Keep the dispatch time, request ID if issued, feature, route policy and error outcome. That record can help determine which component received the body and where processing stopped.
Does a quiet monitoring period establish zero data retention?
- A quiet period records the absence of observed marker use during a defined window. Pair it with a working control, a description of sensor coverage and evidence about the supplier’s actual retention behavior.
What should an engineer do first after a late callback?
- Preserve the event without opening the live marker. Match it to the original dispatch, check previews and support activity, and assign one owner to the first unexplained gap in the timeline.
The most useful deliverable from a canary program is an answer about one specific request. The team should be able to show what it sent, what it observed, which explanation fits the evidence and what it changed as a result. That is a practical standard an application owner can demand of an inference route before trusting it with more sensitive work.
 Turkish
 English
 German
 French
 Spanish
 Portuguese
 Japanese
 Korean
 Hindi
 Arabic
 Hebrew